Introduction to OS6
OS6 is Luna’s Linear Asset Monitoring System.
The purpose of this document is to provide an overview of the major features which are avaialble in the Luna OS6 Software. It provides an overview of the major System functionality and explains these features and tools available.
Acronyms/Terminology
| Acronym | Meaning |
|---|---|
| CU | Control Unit |
| PU | Processing Unit |
| OPS | Optical Processing System |
| IU | Interrogator Unit |
| DAS | Distributed Acoustic Sensing |
| DTS | Distributed Temperature Sensing |
| TOTP | Time-based one-time password |
| 2FA | Two Factor Authentication |
| Terminology | Meaning |
|---|---|
| Control Unit | Control Unit A Windows-based PC built specifically to run the OS6 GUI and monitor an asset |
| Processing Unit | A (Linux) server specifically to process/store the data from the Interrogator Unit |
| Interrogator Unit | An Luna proprietary product that connects to the fibre and performs Distributed Acoustic Sensing (DAS) measurements |
| Optical Processing Unit | A multi-component system comprising an Interrogator Unit and Processing Unit. |
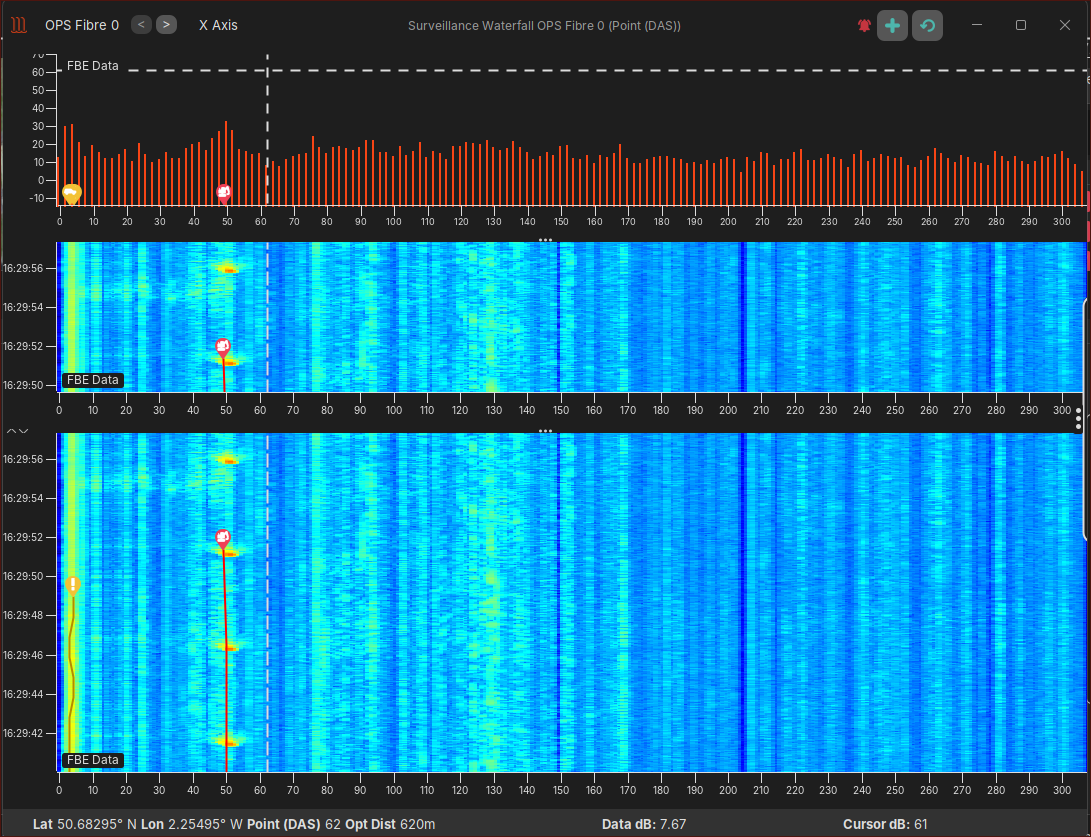
| FBE Data | A chart displayed in real time on the Surveillance Waterfall Window. It represents the amplitude of the sound observed by each DAS location |
| Waterfall | A dynamic chart that represents live & historical data from the histogram. Location is represented along the x-axis; time is shown on the y-axis and amplitude of the signal is represented by varying colours. |
Users
There are four different user access levels:
- 'Light User' - Read-only access with limited functionality
- 'User' - Ability to acknowledge/dismiss alerts
- 'Trained User' - As 'User' with addtional privileges such as area editing and area suppression
- Elevated Trained User (Super User) with full access to make changes to Detectors and System Architecural changes
Users will need to provide a unique name and associated password. This password must meet the password complexity requirements.
Super Users
Trained Users may login with Super User privileges via the TOTP process. This privileged access will automaitcally time out after a number of days.
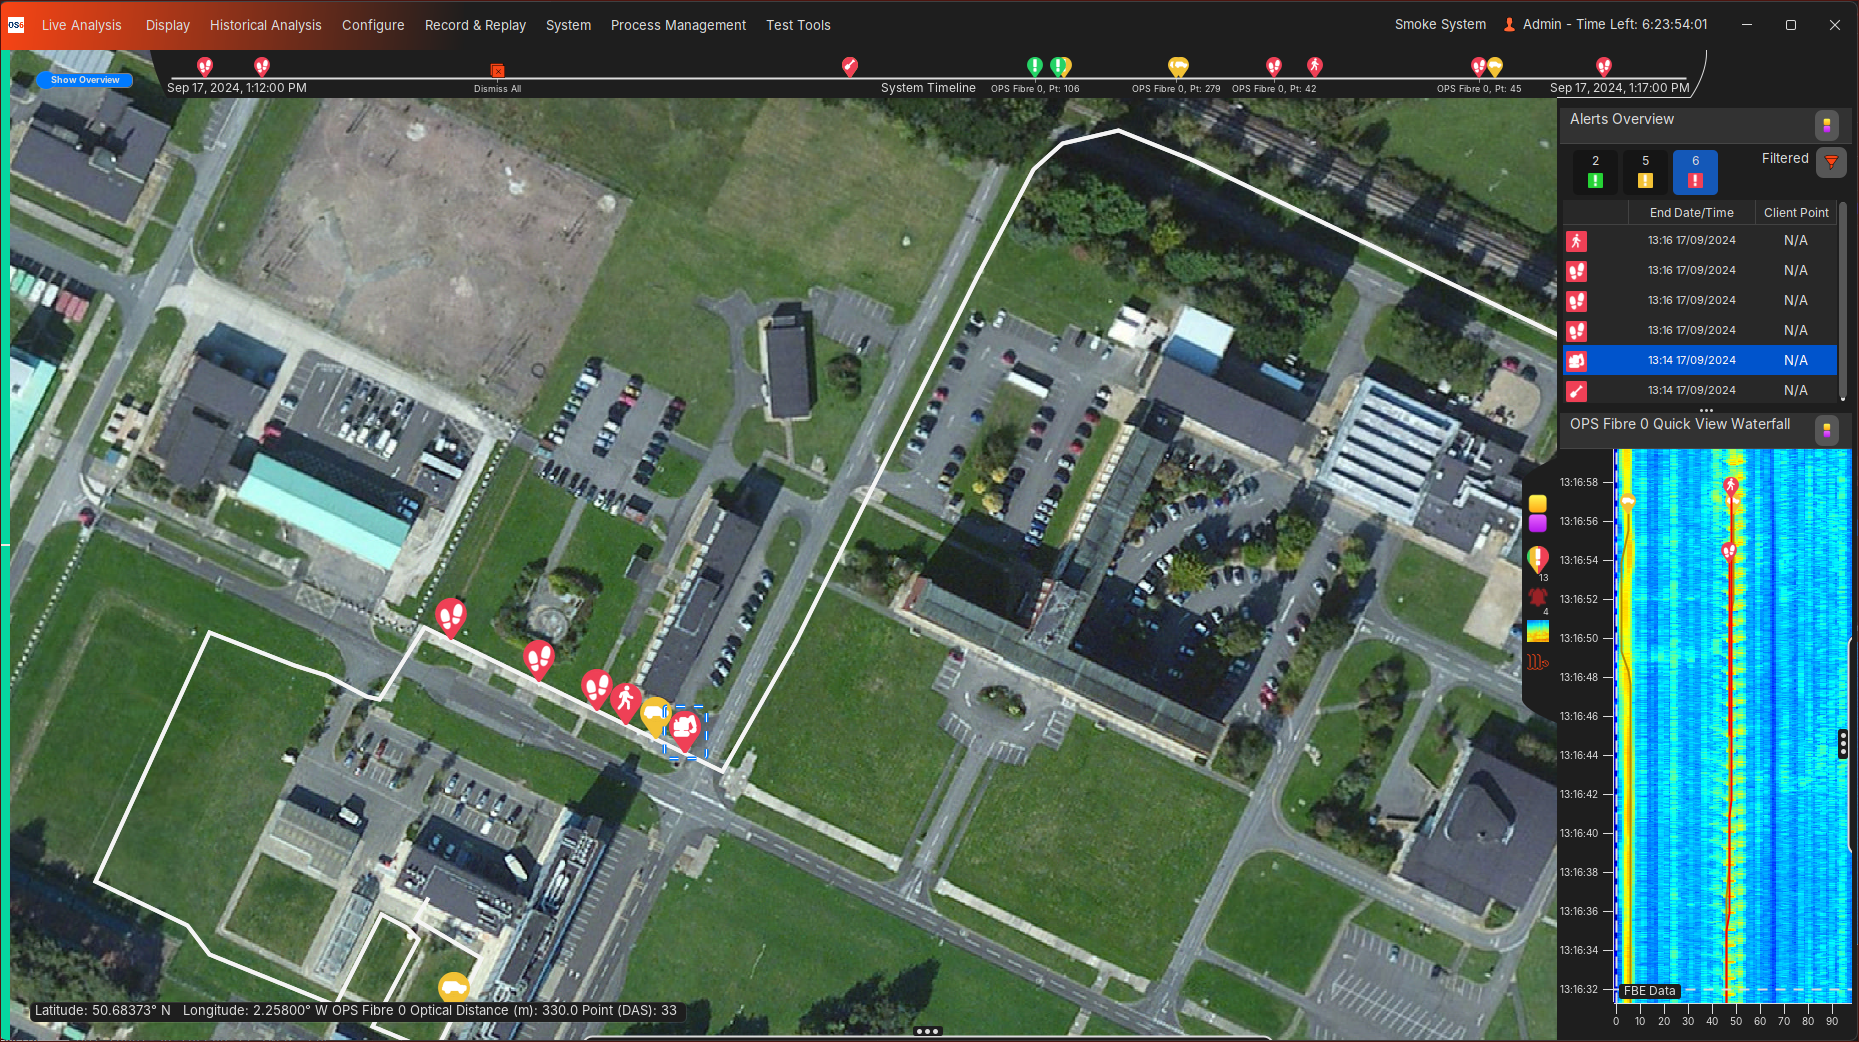
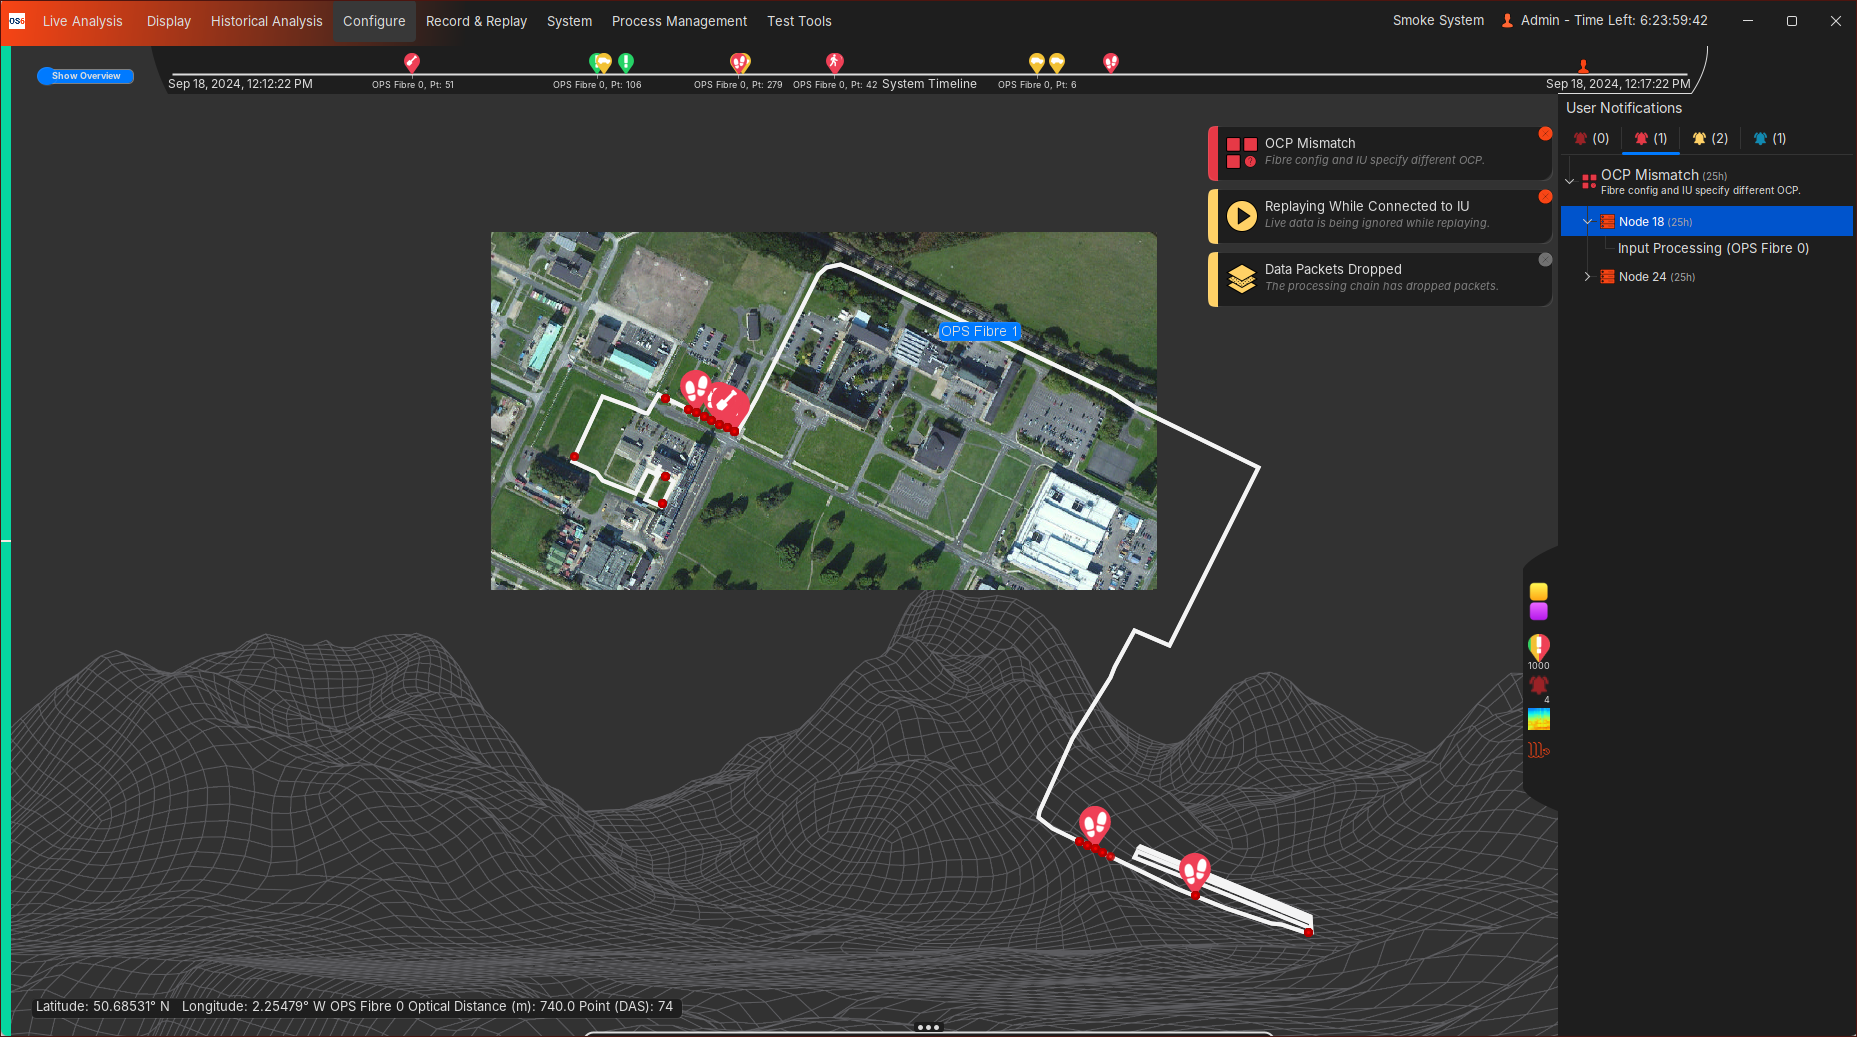
Map Overview
This display proivdes an overview of the system by:
- Showing the Customer fibre/asset routes
- Highlighting alerts along the fibre/asset routes
- Highlighting system health information
- Providing access to all other features/displays
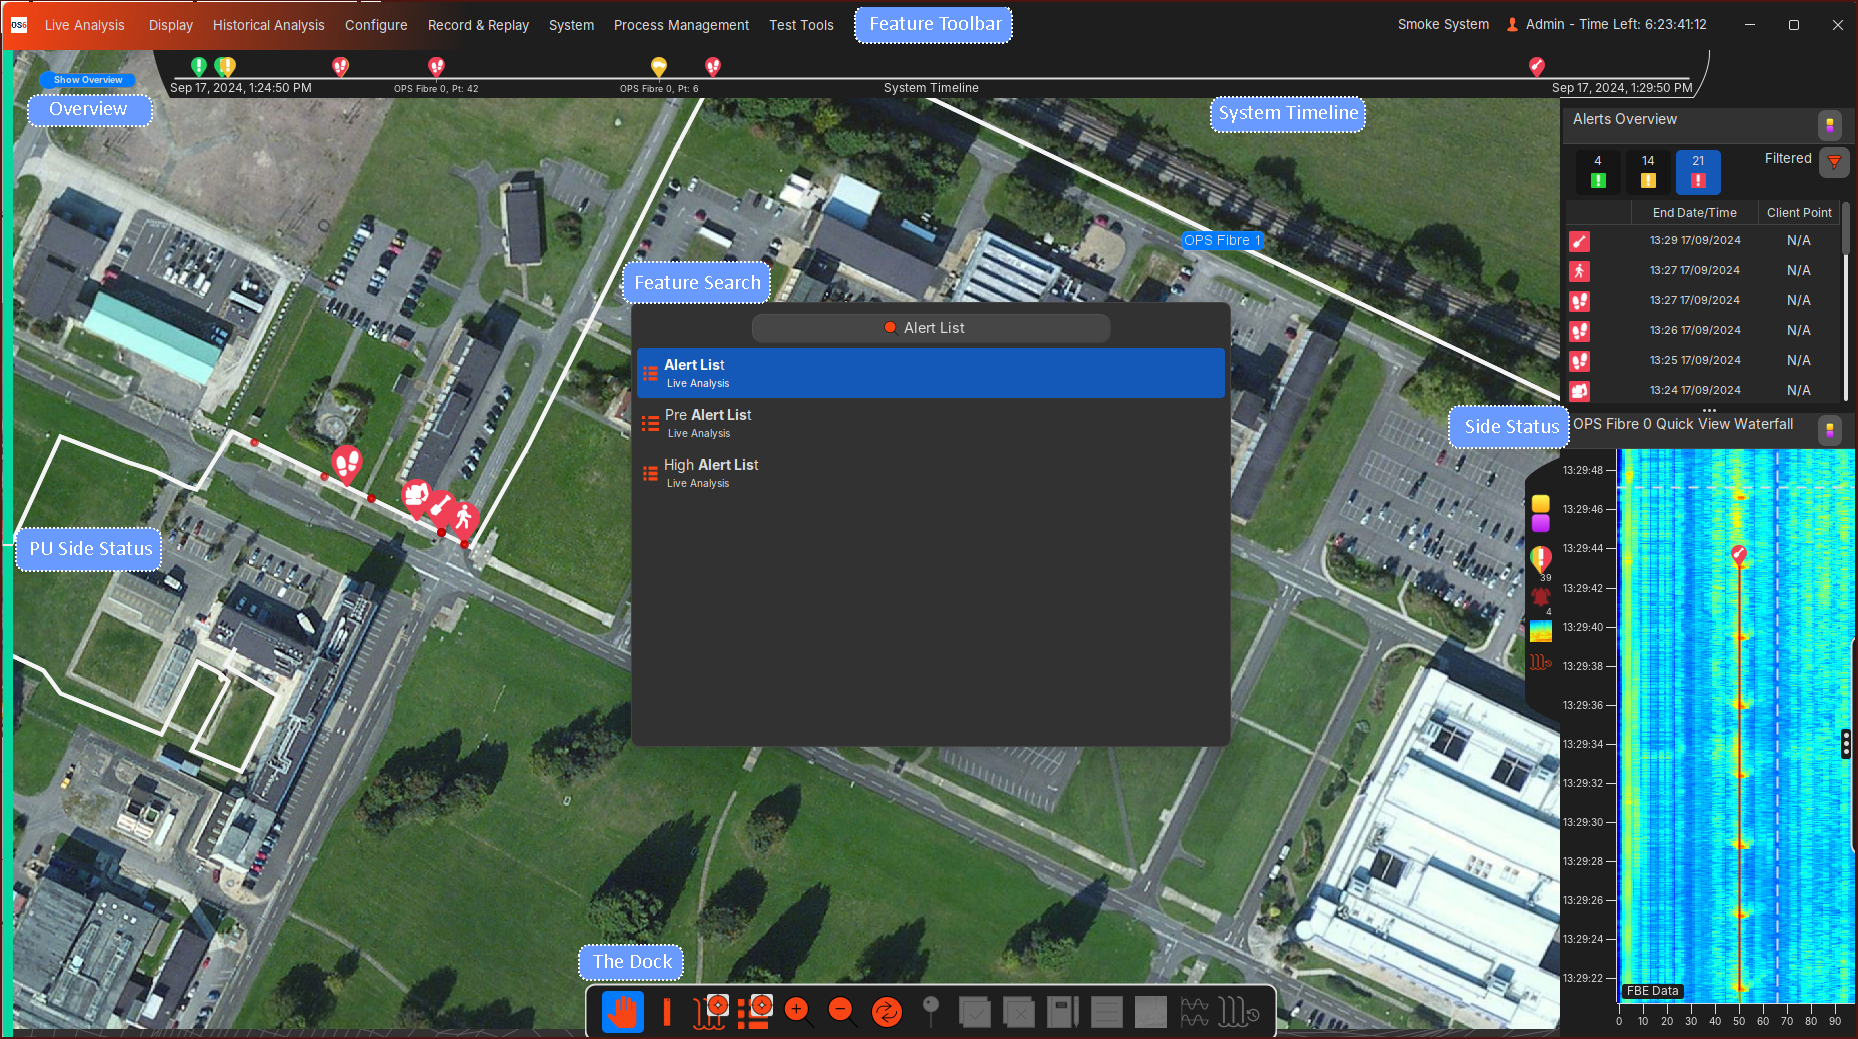
Feature Search/Feature Toolbar
All OS6 features and options can be found under the Feature Search or Feature Toolbar.
The quickest way to access any feature/window is to use the keyboard. Simply start typing the content you are looking for (e.g. waterfall) and the relevant options will pop up. To find the same content without using the keyboard, users can instead use the Ribbon Toolbar, where content is categorized under relevant menu headings.
Side Status (Right-hand Panel)
Alert Lists, Waterfalls (Live/Historical), User Notifications can be overlayed on the Map Overview as single display, or split between two displays.
System Timeline
Events generated by the system or events generated by a user's action is shown on the Timeline. All events can be historically viewed in Auditing.
PU Side Status (Left-hand Panel)
Highlights the status of OS6 processes on each PU.
- Green indicates the processes on the PU are operating as expected.
- Red indicates there is an issue with the processes on the PU.
- Grey indicates that the processes on the PU have been turned off by an Operator.
Alerts
Detection and Output
OS6 has a suite of algorithms to detect, classify and locate a variety of events.
Once an activity has been detected, localised and classified, an OS6 alert will be created with details of the event (time, location, importance/level, type etc.).
All alerts will be displayed on associated fibre on the Map Overview, and displayed in Alert Lists as seen below:
Opened waterfall displays will also track alerts while they continue to update:
![]()
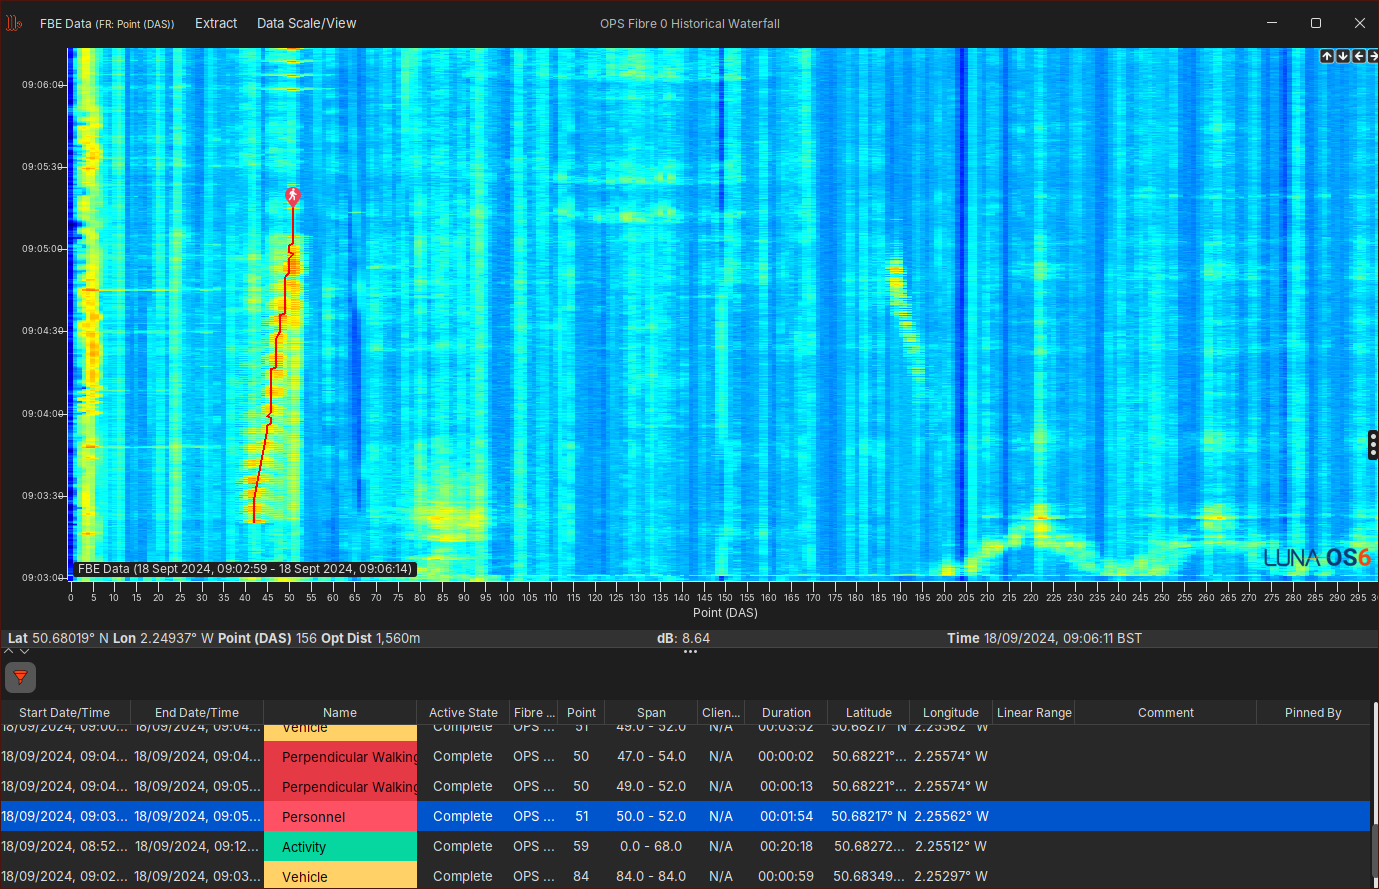
Live Waterfall
The Live Waterfall can be to visualize the activity (FBE Data as standard) per fibre and thus aid the user in understanding the context of any activity/alerts being produced.
Alert User Actions
The user can perform a number of actions on alerts, including viewing updaes, Acknowledging and Dismiising the Alert. These actions can be found by right-clicking on the Alert in the Alert Lists.
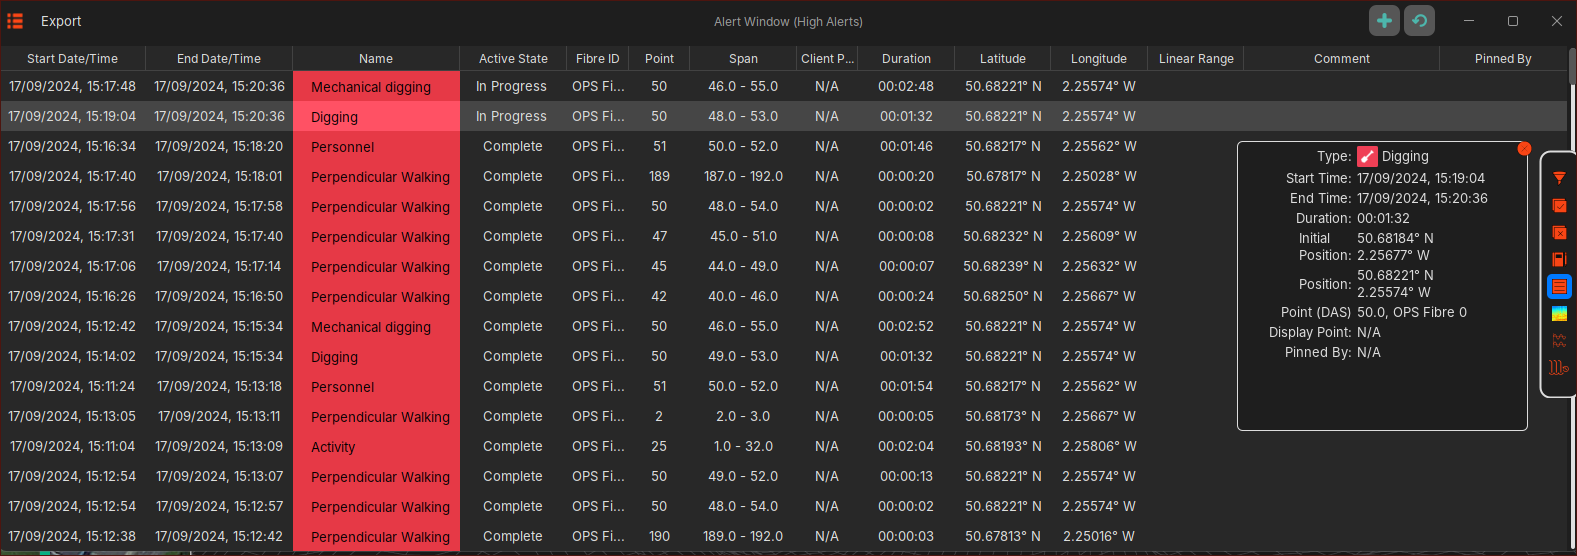
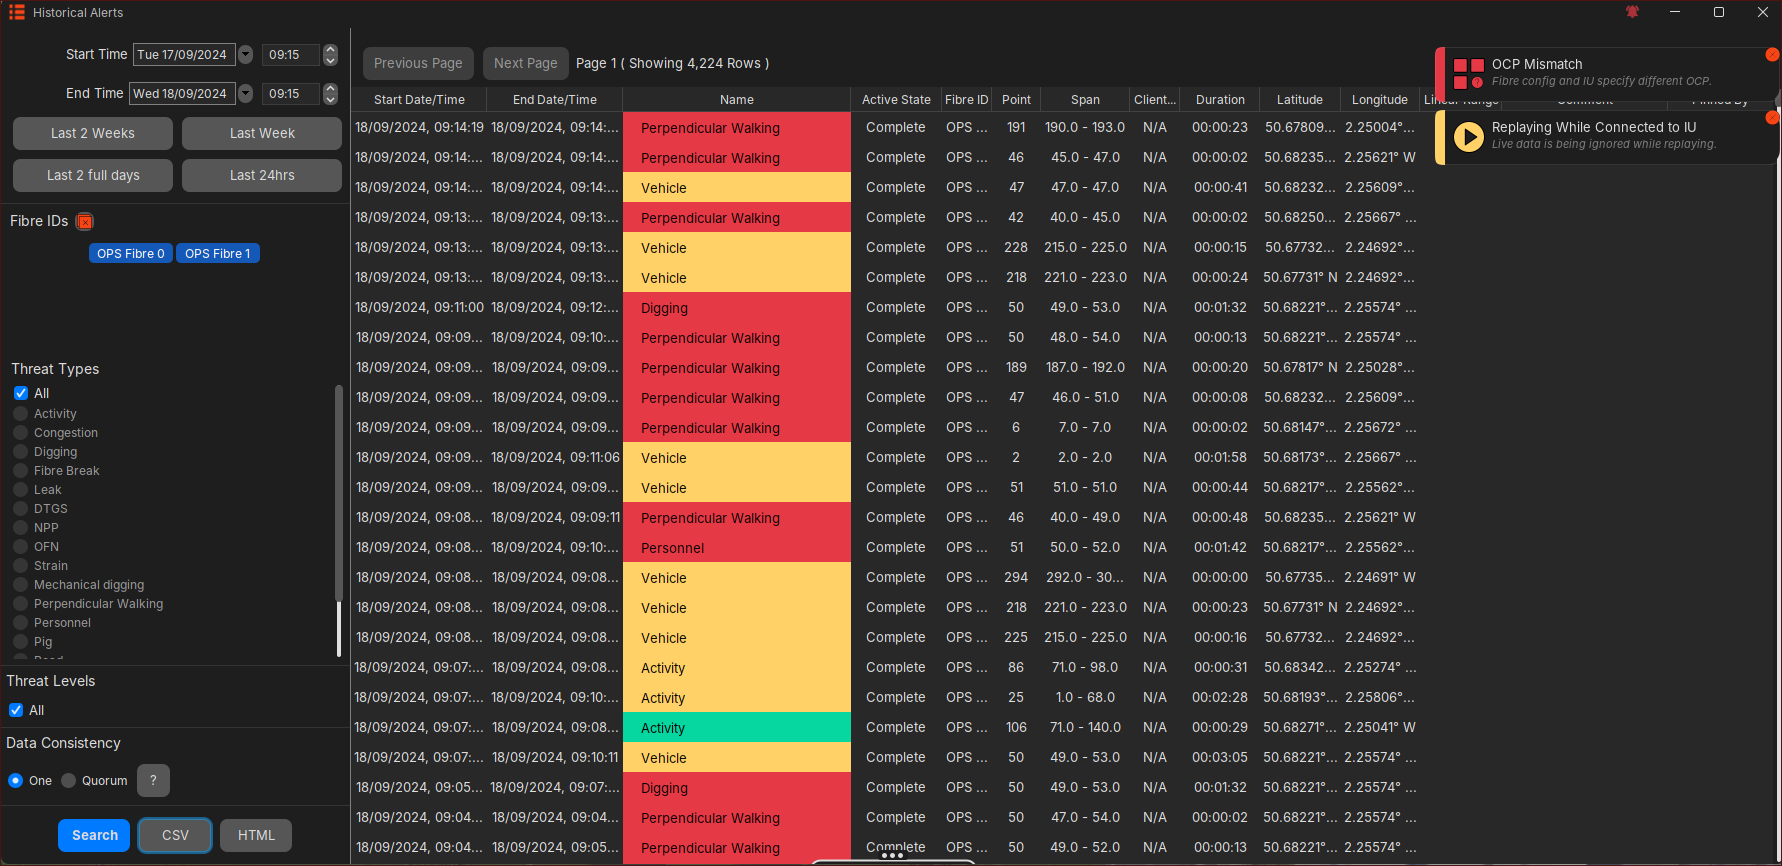
Historical Alerts
A number of tools allow the user to search and analyse historical alerts.
Historical Alert List
An 'Historical Alert' is classed as an alert that is no longer being updated and has 'Completed'. Once an alert has 'Completed', it will be available in the 'Historical Alerts' analysis tool. Users are able to list all historical alerts of the system using a time range, fibre(s) and alert type search options. Users are able to extract the historical alert list (eg. CSV format)
Historical Waterfall
All the data seen in the Live Waterfall is stored on disk through OS6's Rolling Recorders, and can be viewed at a later date (provided the data is still available on disk) on the Historical Analysis/Waterfall displays.
Alert Filtering
Each GUI can be setup to display specific alert types, alert levels and fibres. This configuration is unique to each GUI connected to the system will be remembered upon GUI start-up.
Users can also apply additional alert filtering on the Alert Lists (Live & Historical). This additional filtering is not persisted and will be lost upon GUI restart or the Alert List being closed.
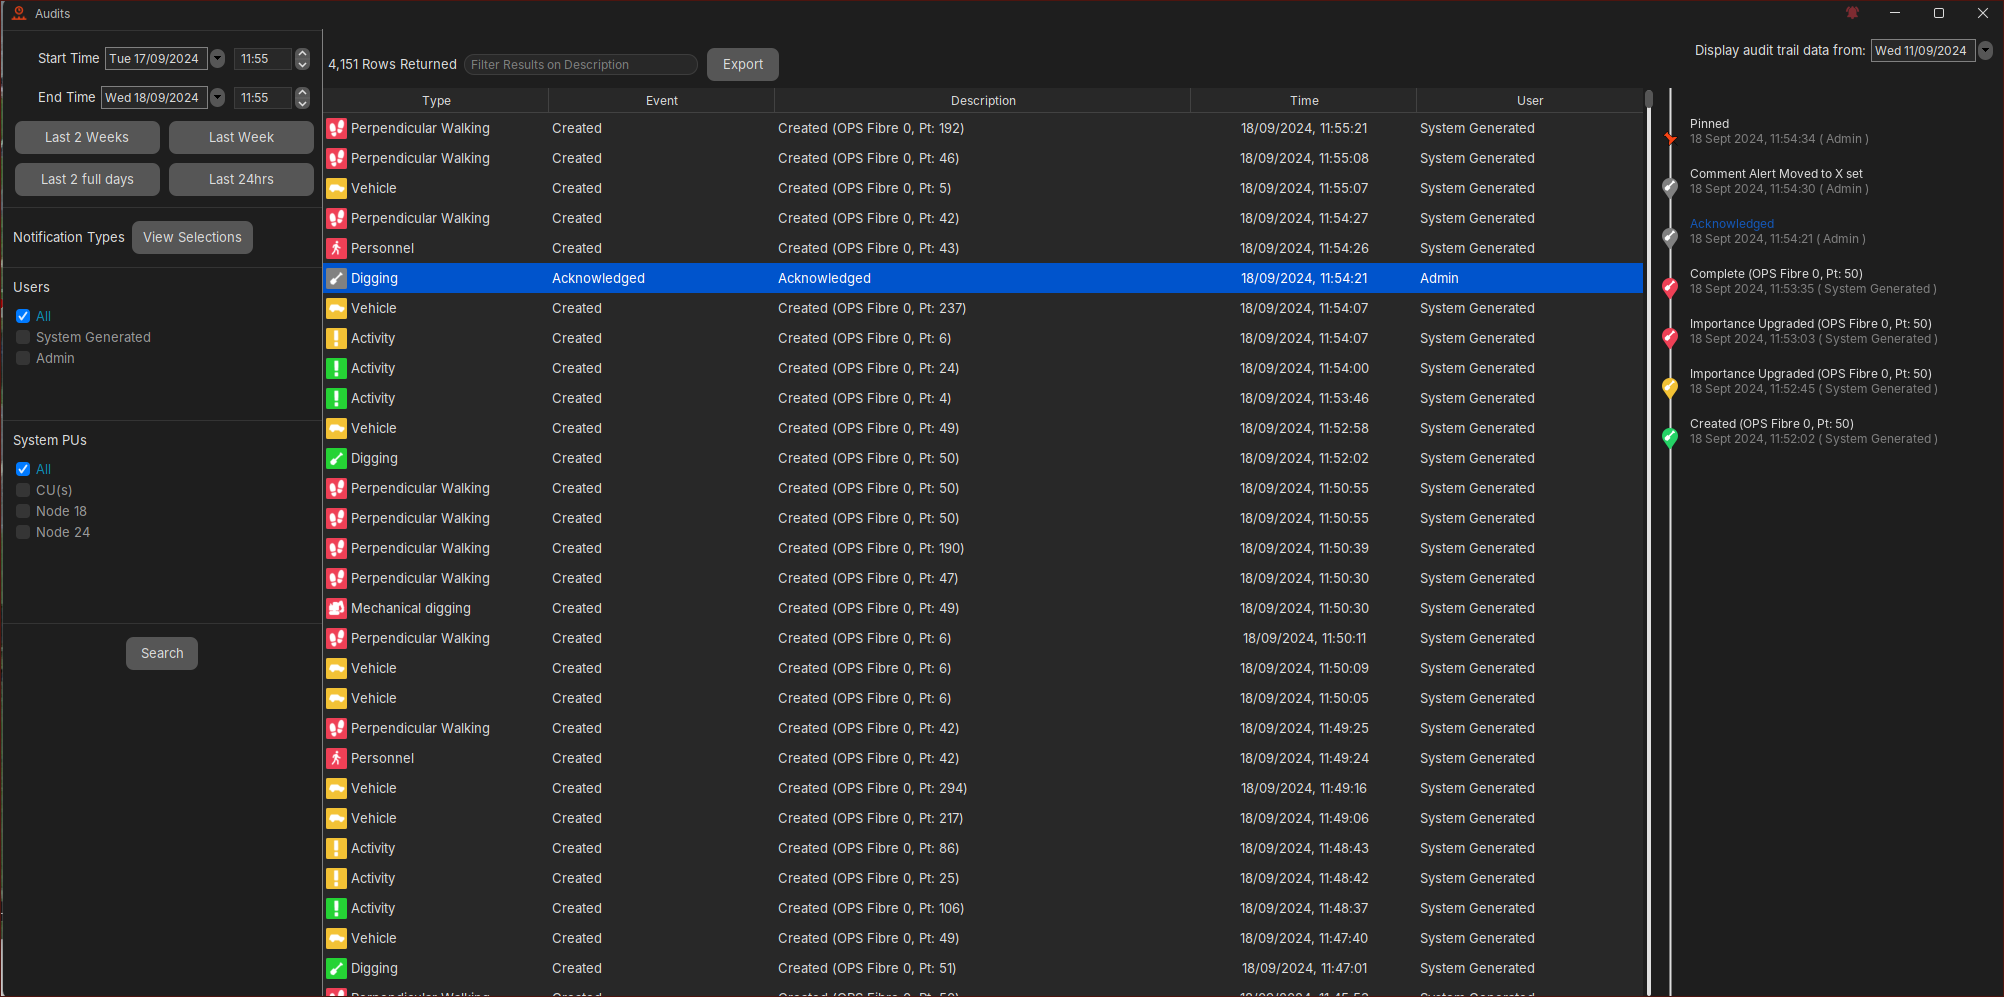
Auditing
Auditing activities can also be interrogated with detailed information supported on each entry. OS6 offers ‘System’ auditing as well ‘User’ auditing against named accounts for forensic analysis purposes. Events seen on the Live Timeline (seen above) will be viewable in Auditing.
Auditing Features
The auditing tool allows various search and export functions to aid forensic analysis. These include:
- Detector changes
- System/Process changes
- Alert Lifecycle changes (comments, acknowledgement etc)
- User Account changes (login, changes to an account, account deletion)
- Suppression Changes
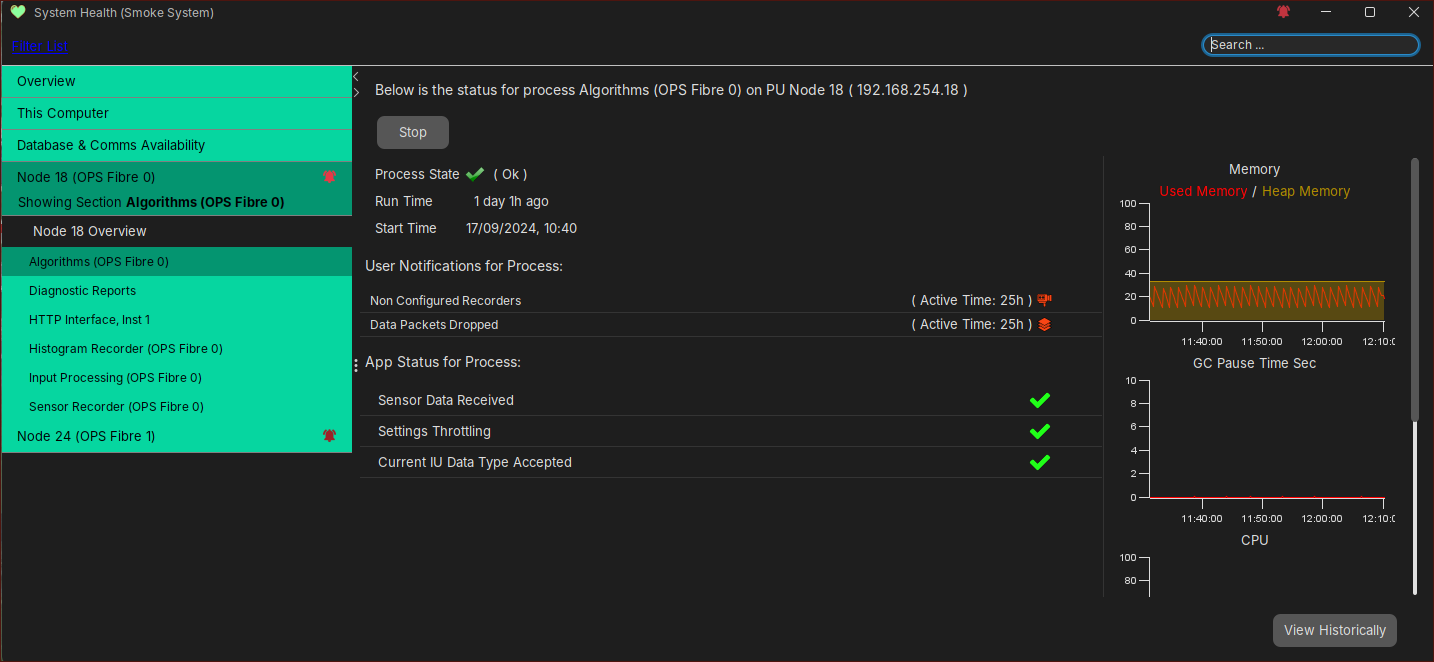
Health
Application Status
A PU has a number of OS6 processes running each with their own distinct role. Each process will report its status using a colour indicator:
- Green indicates the preocess is operating as expected
- Red indicates there is an issue with the preocess
- Grey indicates that the preocess has been switched off
Users can drill down on each application per PU to get more details.
To view the Application Status, this can be found on the PU Side Status (Map Overview), the Overview (Map Overview) and the System Health display as seen below:
User Notifications
These notifications can range from informative to time-critical errors where immediate action is required.
These User Notifications will be shown as popups on all relevant displays and the Map Overview, with a more detailed breakdown of any User Notification available on the System Health display or Side Status (Map Overview).
Overall System Health
It is critical that Operators monitor the System Health and the User Notifications. These issues should be dealt with promotly.
Contact Information
Contact our team of technical experts for further support and enquiries: